X
Audimation Services has been acquired by Caseware International Learn More.

In business, predicting the future is never an easy task. But CaseWare IDEA® can help as long as you have the right data. Trend Analysis will generate a chart of your data and apply a trend line to it to show the trend of past data. You will also have the option to generate a forecast of future data that is based on the pattern of your past data.
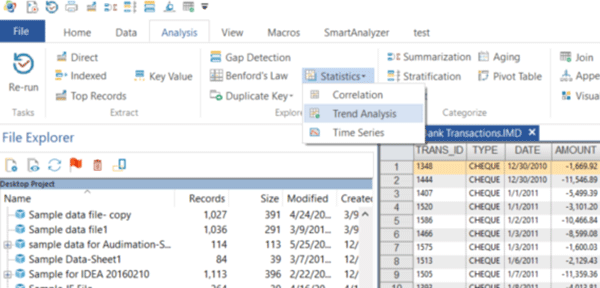
To begin, import your data into IDEA and open the database. You should have at least one numeric field and the data should be sorted in order from oldest to the most recent records. Select the Analysis tab, then click Statistics > Trend Analysis to open the Trend Analysis window.
In the top left, select the field that you want to view the trends for. This must be a numeric field. In fact, non-numeric fields will not appear on this list. Only one trend field can be selected. In most cases, this is a monetary field, but any numeric field will work.
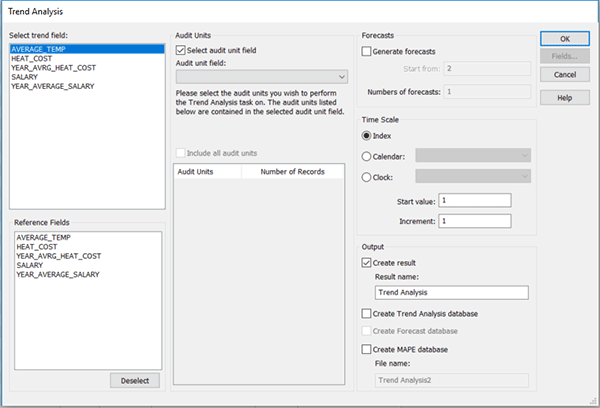
Optionally, you can select a Reference field in the bottom left. This must also be a numeric field, but it cannot be the same field as the one you are running the Trend Analysis on. Note that any field you select as a reference field will not affect the analysis. It is only there as a reference to compare against the trend field.
Another option is the Audit Unit field. Adding an audit unit field will provide a means to group data. For example, if you are analyzing a database showing the average salary, you might find it useful to group the results by the branch. Each audit unit must contain more than one record and cannot be the same field selected for the trend analysis. They also must have the same number of records for each unit.
Yet another option is the ability to add a forecast to your result. This will extend the trend line a specified number of forecasts. A forecast is a prediction of future results based on past data. For example, if you are analyzing a database with 1000 records, you might want to add 100 forecasts to the trend analysis to predict what the next one hundred records may look like. The number of forecasts cannot exceed the number of records for each audit unit.
The next step is to specify the time scale you want to use for the trend analysis. The options are Index, Calendar, and Clock. If you select Index, the results will number the x-axis from 1 to N where N is the number of records being analyzed. For example, monthly data for five years will be numbered from 1 to 60. Selecting Calendar will allow you to specify if you want to number the x-axis based on Days, Years, Months or Quarters. Similarly, choosing Clock will allow you to number the x-axis based Hours, Minutes or Seconds.
Finally, select from a list of output options and click OK to create the result.
When the Trend Analysis completes, you will be presented with a graph displaying your data.
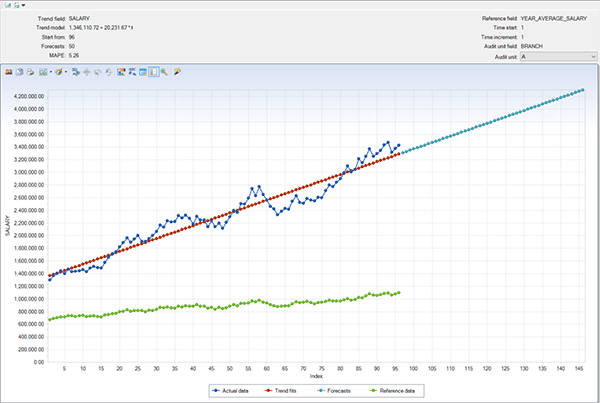
The dark blue points represent the actual data in the specified trend field. They are organized from the oldest records on the left to more recent records on the right. The red line is the trend line showing the general trend of the amount field. This allows you to easily identify the positive or negative slope in your data. The light blue line extending the trend line to the right shows the forecasted trend based on past records. The green line displays the data in the reference field. Finally, if you decided to use Audit Units, you can switch between those views by using the drop-down menu in the top right.
We hope this will be very helpful to your team. And, as always, if you have questions about this Tech Tip or other IDEA questions, please give our help desk a call at:
888-641-2800 Option 4
Or email us at [email protected]


This website has been designed for modern browsers. Please update. Update my browser now